
In 2026 your website is not judged by how it looks. It is judged by how fast it feels. If you run a business online — a SaaS, a store, a service site, a portfolio that generates leads — page speed is no longer a "technical detail" you can hand off and forget. It is the single most visible signal of quality your visitors and Google receive before they read a word of your content.
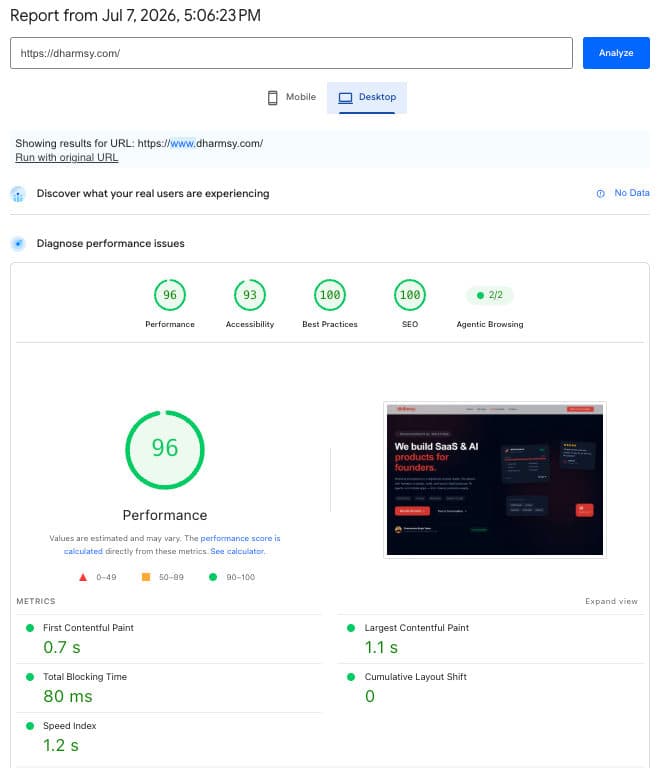
This post is a long, honest look at why page speed has quietly become the most important on-page SEO factor of 2026, what Google is actually measuring today, and what you should do about it if your business runs on a website. At the end I'll walk through a real PageSpeed Insights report — the one shown in the hero image — and show you exactly what a healthy score looks like right now.
1. The Web in 2026: Faster Users, Higher Expectations
Somewhere between 2023 and 2026, users stopped tolerating slow websites. It didn't happen all at once. It happened the way habits change — one competitor at a time. Apple, Shopify, Notion, Linear, Vercel, Stripe — the sites people use every day now open in under a second. That has quietly reset the baseline for every other website on the internet, including yours.
Google's own data (Chrome UX Report, 2026) shows that the median mobile page load time on top-ranking pages is now under 1.4 seconds. Ten years ago, three seconds was considered "fast." Today, three seconds is the point at which more than 40% of your visitors have already tapped back to the search results.
If your business site takes four seconds to become interactive on a mid-range Android phone in Bangalore or Mumbai, you are not competing with the sites in the search results. You are subsidising them.
2. What Google Is Actually Measuring in 2026
Page speed as a ranking factor has evolved from a vague "faster is better" signal into a set of very specific, measurable thresholds. As of 2026, three metrics drive most of Google's performance-related ranking behaviour:
- Largest Contentful Paint (LCP) — how long it takes for the biggest visible element (usually a hero image, headline, or banner) to render. Google's "Good" threshold is under 2.5 seconds.
- Interaction to Next Paint (INP) — replaced First Input Delay in March 2024. INP measures the responsiveness of every interaction on the page (taps, clicks, keystrokes). Anything above 200ms feels broken to users.
- Cumulative Layout Shift (CLS) — how much your page visually jumps around while loading. A CLS above 0.1 is a ranking penalty. Ads and late-loading images are the biggest offenders.
These are the "Core Web Vitals." They are not a suggestion — they are part of Google's page-experience ranking system, and Google surfaces them directly in Search Console for every URL on your domain. If your top revenue pages are marked "Needs Improvement" or "Poor," you are handing rankings to your competition.
New in 2026: agentic browsing scores. Google now measures how well your page renders and can be understood by autonomous browsing agents (like the "Agentic Browsing" chip in the PageSpeed report). Sites that lazy-load critical content or hide it behind JavaScript that agents can't execute score poorly — and that score is starting to leak into ranking.
3. The Real Business Cost of a Slow Site
Let me put this in numbers a business owner can feel.
- A one-second delay in mobile load time reduces conversions by ~20% (Google/Deloitte, 2024, reconfirmed 2026).
- Amazon's internal data suggests every 100ms of latency costs about 1% in sales. That number has held remarkably steady for a decade.
- Pinterest famously cut perceived wait time by 40% and grew SEO traffic by 15% and sign-ups by 15% — from performance work alone.
- A 2025 SEMrush study across 15,000 e-commerce sites found that pages in the top 3 organic positions were, on average, 1.8 seconds faster than pages on page two.
Translate that to a small business site: if you're getting 10,000 monthly visitors and converting at 2%, cutting your load time from 4s to 1.5s realistically pushes conversions to 2.6–3%. That's another 60–100 leads a month — with no extra ad spend, no new content, no new backlinks.
This is why "invest in page speed" is one of the highest-ROI things a business site owner can do in 2026. It compounds. Every visitor from now until forever gets the faster experience.
4. A Real PageSpeed Insights Walkthrough
The screenshot above is a live PageSpeed Insights report from July 2026 for dharmsy.com, my own portfolio site. Let's read it together, because most business owners have never actually opened this tool.
Here's what each number is telling you:
- Performance: 96/100 — a Lighthouse composite of six lab metrics. Anything above 90 is "green" and considered fast. Under 50 is failing.
- Accessibility: 93/100 — how well the page works for users with screen readers, keyboards, colour blindness, etc. Google increasingly ties this to trust signals.
- Best Practices: 100/100 — HTTPS, safe browsing, modern image formats, no console errors, no deprecated APIs.
- SEO: 100/100 — meta tags, mobile viewport, crawlability, structured data basics.
- Agentic Browsing: 2/2 — new in 2026: page renders fully to autonomous agents without requiring interactive JavaScript.
Then the Core Web Vitals row at the bottom:
- First Contentful Paint: 0.7s — the browser painted something in under a second. Users feel the site "arrive."
- Largest Contentful Paint: 1.1s — the hero image and headline are visible in just over a second. Google's threshold is 2.5s.
- Total Blocking Time: 80ms — the main thread was blocked by JavaScript for only 80ms total. Anything under 200ms is excellent.
- Cumulative Layout Shift: 0 — nothing on the page moved after painting. Perfect.
- Speed Index: 1.2s — how quickly the content visually populated.
This is what a healthy business website looks like in 2026. If your report shows red or orange next to any of these — especially LCP, INP, or CLS — you have work to do, and Google can see it.
5. Why Most Business Websites Are Slow (Without Anyone Noticing)
Nine out of ten business websites I audit are slow for the same handful of reasons. None of them are dramatic. They accumulate over years, one plugin at a time.
- Unoptimised hero images. A 3.2 MB PNG hero image on the homepage. That single file often costs a full second on 4G.
- Too many third-party scripts. Facebook pixel, GA4, HubSpot, Hotjar, LinkedIn Insight, three chat widgets, a cookie banner, and a "live visitor" popup. Each adds 100–400ms.
- Bloated CMS themes. WordPress themes that ship 40 JavaScript files and 12 fonts because "you might need them."
- No CDN. The site loads directly from a single server in one region. Users in the US, EU, and India get wildly different experiences.
- Client-side rendering everything. A React or Vue SPA that ships 500KB of JavaScript before the user sees a single word.
- Legacy image formats. Still shipping JPEG when WebP and AVIF are supported everywhere and 60% smaller.
- Render-blocking CSS and fonts. Google Fonts loaded synchronously from the CDN, freezing the render for 200–600ms.
- No caching. Every visitor downloads every asset from scratch on every visit.
- Layout shift from ads and embeds. That YouTube embed that pushes your CTA button down 300px right as the user is about to tap it.
- Legacy database queries. Slow queries on the homepage that block server-side rendering for 800ms.
Any one of these is fixable in a day. Together they are the difference between a 42/100 and a 96/100 Lighthouse score.
6. The Fixes That Actually Move the Needle
If you fix nothing else on your business website in 2026, fix these six things. They compound and they are cheap.
a. Serve modern images in modern formats
Convert every image to WebP (or AVIF where supported), resize hero images to the actual display size, and use <img loading="lazy" decoding="async"> for anything below the fold. On Next.js, use next/image. On WordPress, use a plugin like ShortPixel or the built-in WordPress 6.5+ image optimiser.
b. Move to a CDN
Cloudflare, CloudFront, or Bunny CDN — all take an afternoon to set up. This alone typically cuts LCP by 30–50% for international traffic. Your hosting bill also drops.
c. Ship less JavaScript
Every KB of JS is a KB of parse-and-execute time on a low-end phone. Audit your bundle with next build --analyze or WebPageTest. Delete unused libraries. Move analytics and chat widgets to load after user interaction (or on requestIdleCallback).
d. Prerender or server-render your critical pages
If you're on Next.js, use SSG or ISR for landing pages and blog posts. If you're on WordPress, use full-page caching. Do not make Google wait for JavaScript to build your HTML on every request.
e. Reserve space for images, ads, and embeds
Set explicit width and height on every image and iframe. This alone will drop your CLS from something ugly to near zero.
f. Preload the critical font and defer everything else
One <link rel="preload"> for the font your headline uses. Everything else — extra weights, italic, secondary fonts — loads with font-display: swap. This kills the flash-of-invisible-text problem and shaves 200–500ms off LCP.
7. Mobile Is Where the Ranking Is Won or Lost
Google indexes and ranks the mobile version of your site first. If your desktop scores a 96 but your mobile scores a 58, Google ranks you based on the 58. This is why the PageSpeed Insights tool defaults to two tabs — Mobile and Desktop — and why the mobile score is the one that matters commercially.
Mobile is harder because you're competing against slower CPUs, worse networks, and cold caches. The techniques above matter twice as much on mobile. A single 400KB unused JavaScript library that costs 90ms on your MacBook can cost 1.2 full seconds on a ₹9,000 Android phone in Tier-2 India — which is exactly the audience most small businesses are trying to reach.
8. Measurement: Lab vs Field
PageSpeed Insights shows you two kinds of data, and it's important to understand which is which.
- Lab data (Lighthouse) is a simulated run in a controlled environment. Great for debugging — reproducible, actionable, cheap. The 96 score in the hero image is a lab number.
- Field data (Chrome UX Report / CrUX) is what real users actually experience, aggregated from Chrome installs over the last 28 days. This is what Google uses for ranking. New or low-traffic sites often show "No Data" in this section — that's normal.
Fix the lab number first, then wait 4–6 weeks to see field data catch up. That's the loop.
9. Real User Monitoring: The Missing Half
PageSpeed Insights is a snapshot. If you're running a serious business site, complement it with continuous monitoring:
- Vercel Analytics or Cloudflare Web Analytics — free tiers that report real-user Core Web Vitals per page.
- SpeedCurve or Calibre — for teams that want performance budgets and alerting.
- web-vitals library from Google, shipped directly into your site — write LCP, INP and CLS into GA4 as custom events.
You cannot fix what you cannot measure. And you cannot rank for what you're not measuring, either.
10. The 2026 Take: Page Speed Is Now a Trust Signal
Google's algorithms are converging on a very human insight: fast sites feel professional, and slow sites feel abandoned. Users make trust decisions in under 500ms. If your site takes four seconds to become interactive, the visitor's subconscious has already decided you are less credible than the competitor whose site opened instantly.
In 2026, page speed is no longer a "developer thing." It is a marketing thing. It is a conversion thing. It is a brand thing. And it is one of the very few SEO investments where the payoff is immediate, permanent, and impossible for a competitor to steal.
Where to Go From Here
If you take one action after reading this: open pagespeed.web.dev, paste in your homepage URL, and hit Analyze. Read the mobile tab. Look at LCP, INP, and CLS. Anything red is money you're leaving on the table every single day.
Then either fix it yourself using the checklist above — or reach out and I'll take a look. In my experience, one focused week of performance work on a typical business website returns more organic revenue over the next twelve months than any three months of new content ever will.
The web in 2026 is a fast web. Your business either lives on it or it doesn't.